Activity list
The Activities tab lists every ride, run, indoor session, and manual entry, grouped by month.
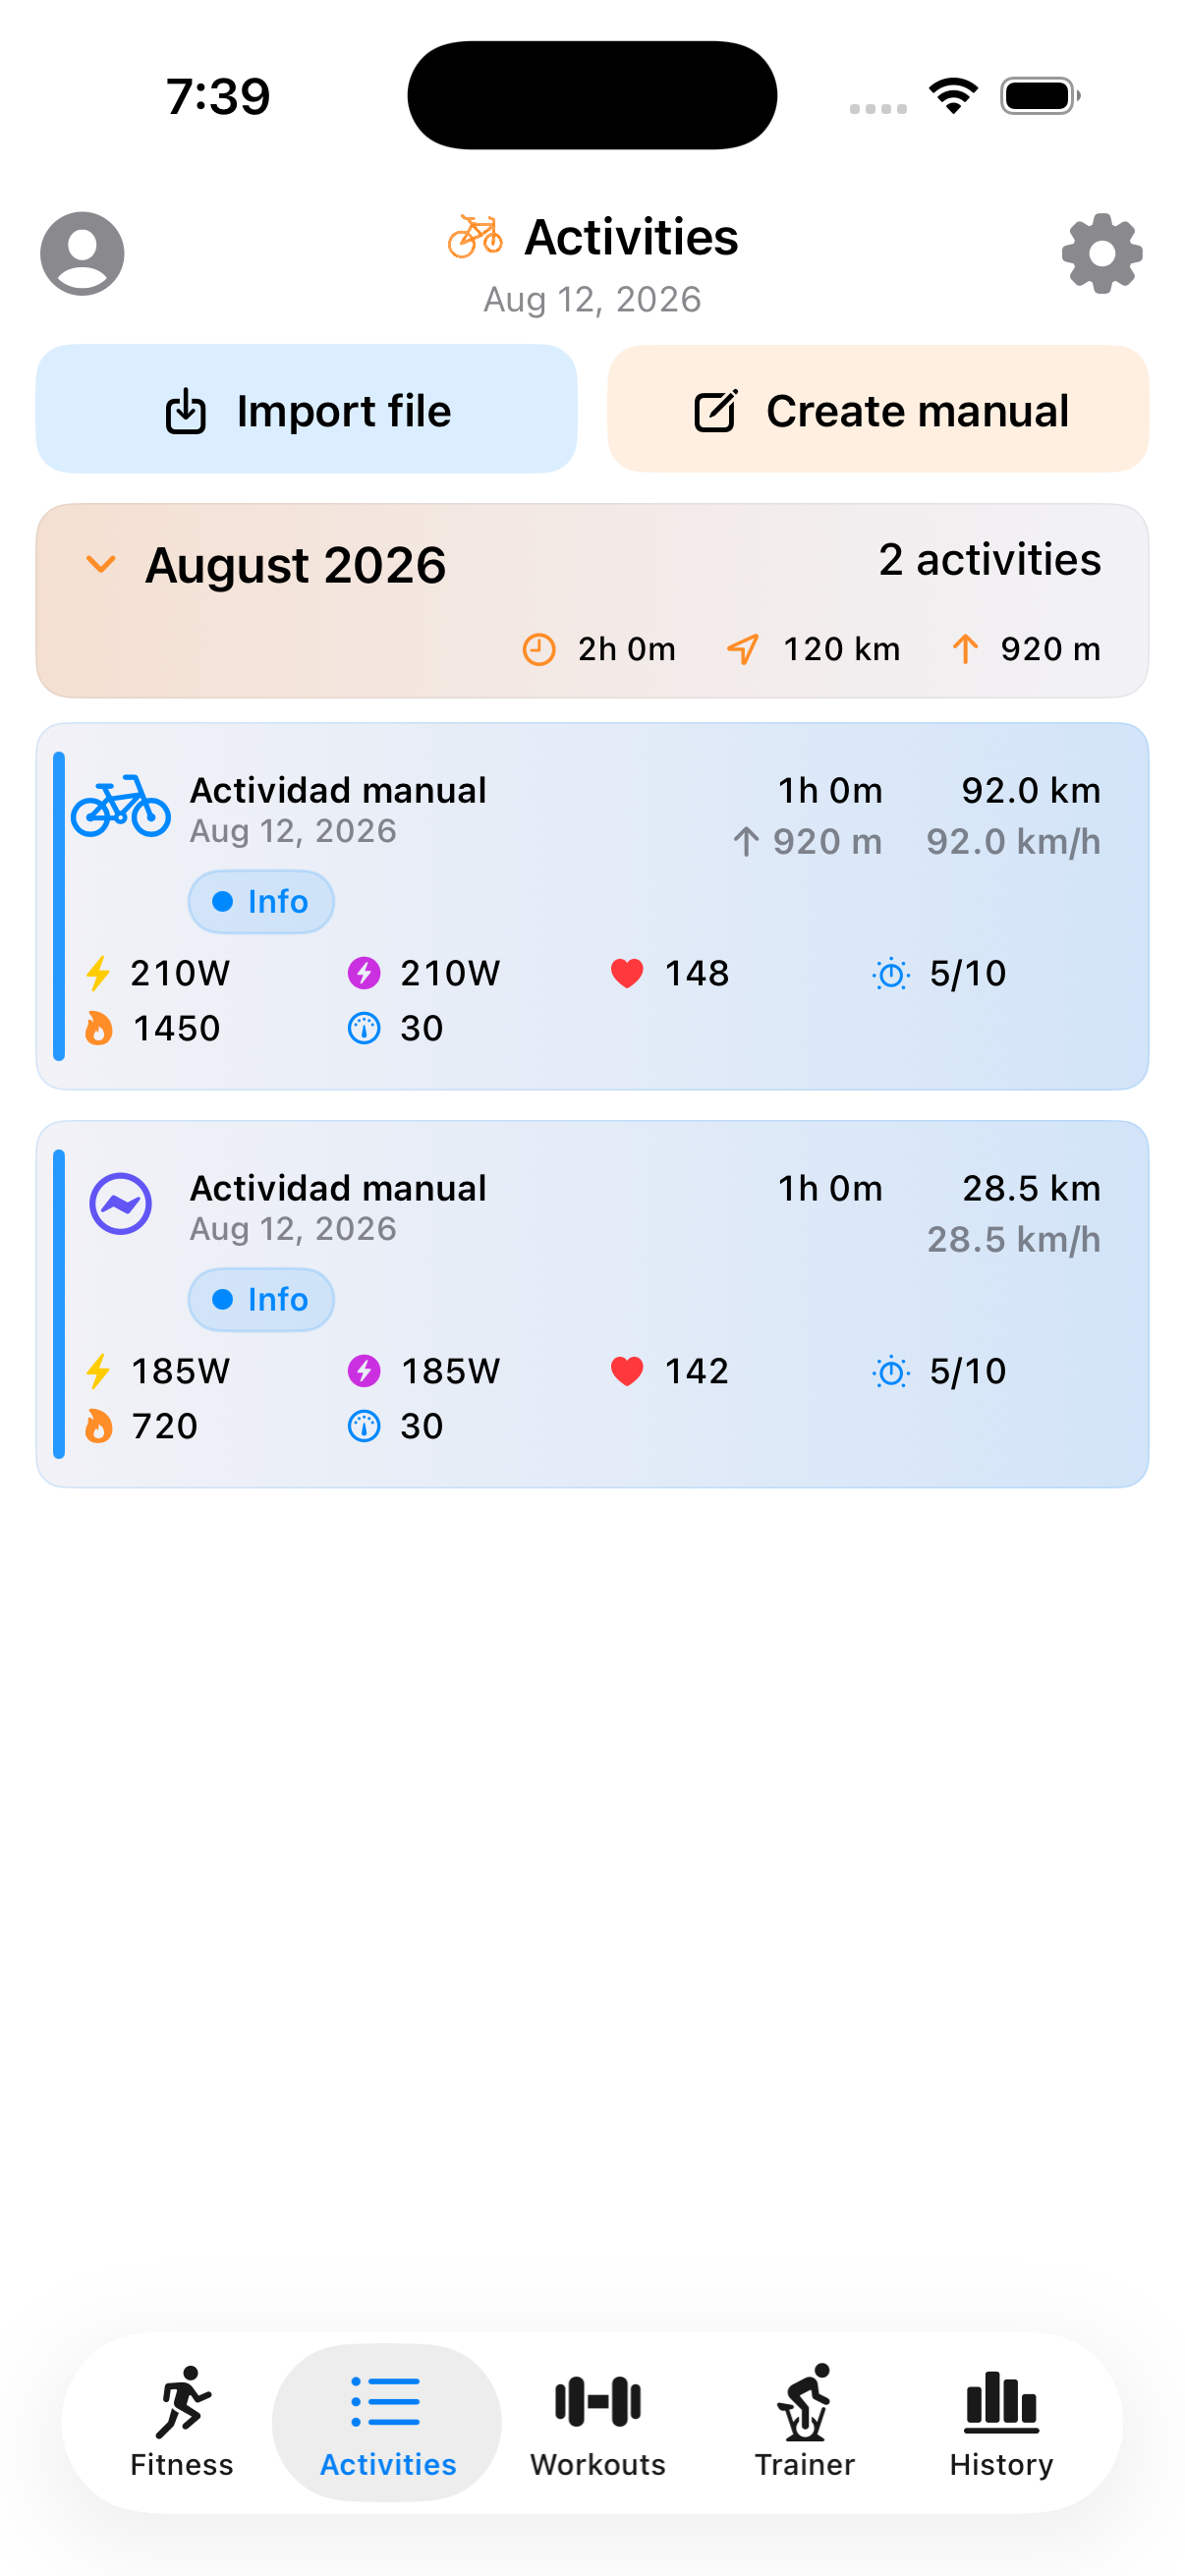
At the top, two buttons: Import file (GPX/TCX/FIT) and Create manual (type numbers in directly).
What each row shows
- Icon and color by activity type (cycling, virtual/indoor ride, run, walk, strength, ...).
- Duration, distance, elevation gain, average speed.
- Power (average and normalized), heart rate, calories, and perceived exertion when available.
- A small sync icon — a blue link icon if the indoor session is uploaded to Intervals.icu, an orange bolt if it's uploaded to Strava, both if it's on both. This only appears for indoor-origin sessions, since regular synced activities are implicitly "already there."
- A colored load badge (green/amber/red) once perceived exertion is set, reading your reported effort against your recent form.
Perceived exertion prompts
Whenever a new same-day activity appears — whether synced from Strava/Intervals.icu or created manually — CyclingIQ can prompt you right away to rate how hard it felt (1–10):
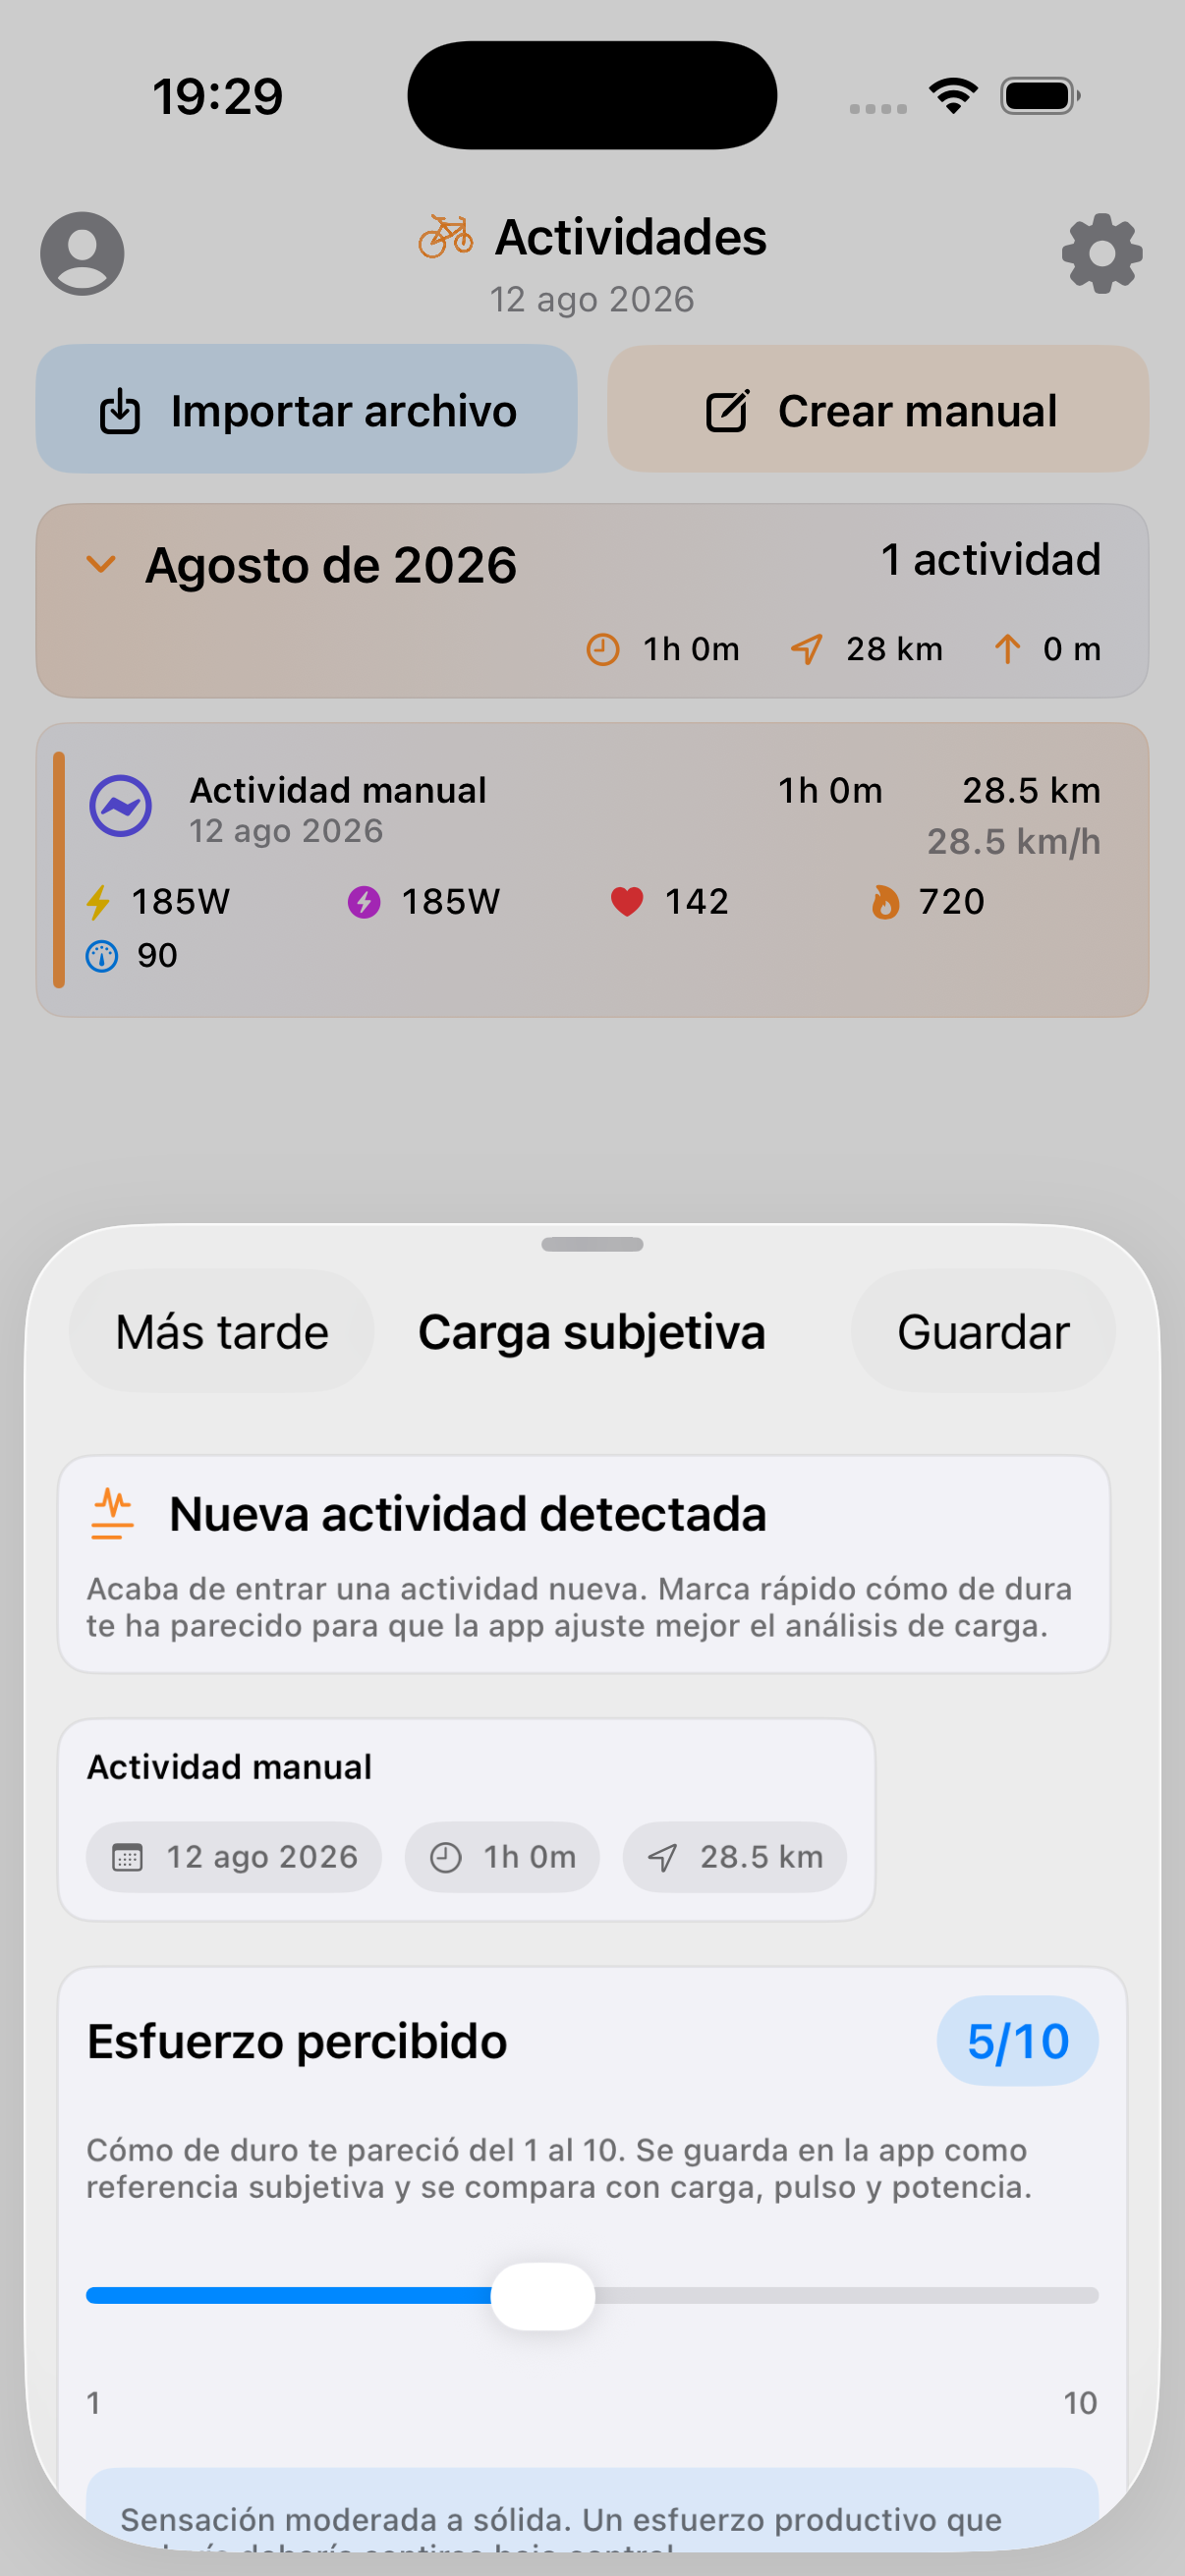
This value feeds the load badge on the row and the session impact analysis on the activity detail screen. You can defer it ("Later") if you have several pending — it'll come back around.
Tap any row to open its full detail.