Activity detail
Tap any row in the activity list to open its full detail screen.
Metrics
Every metric CyclingIQ can compute for the activity, each with an info button explaining what it means:
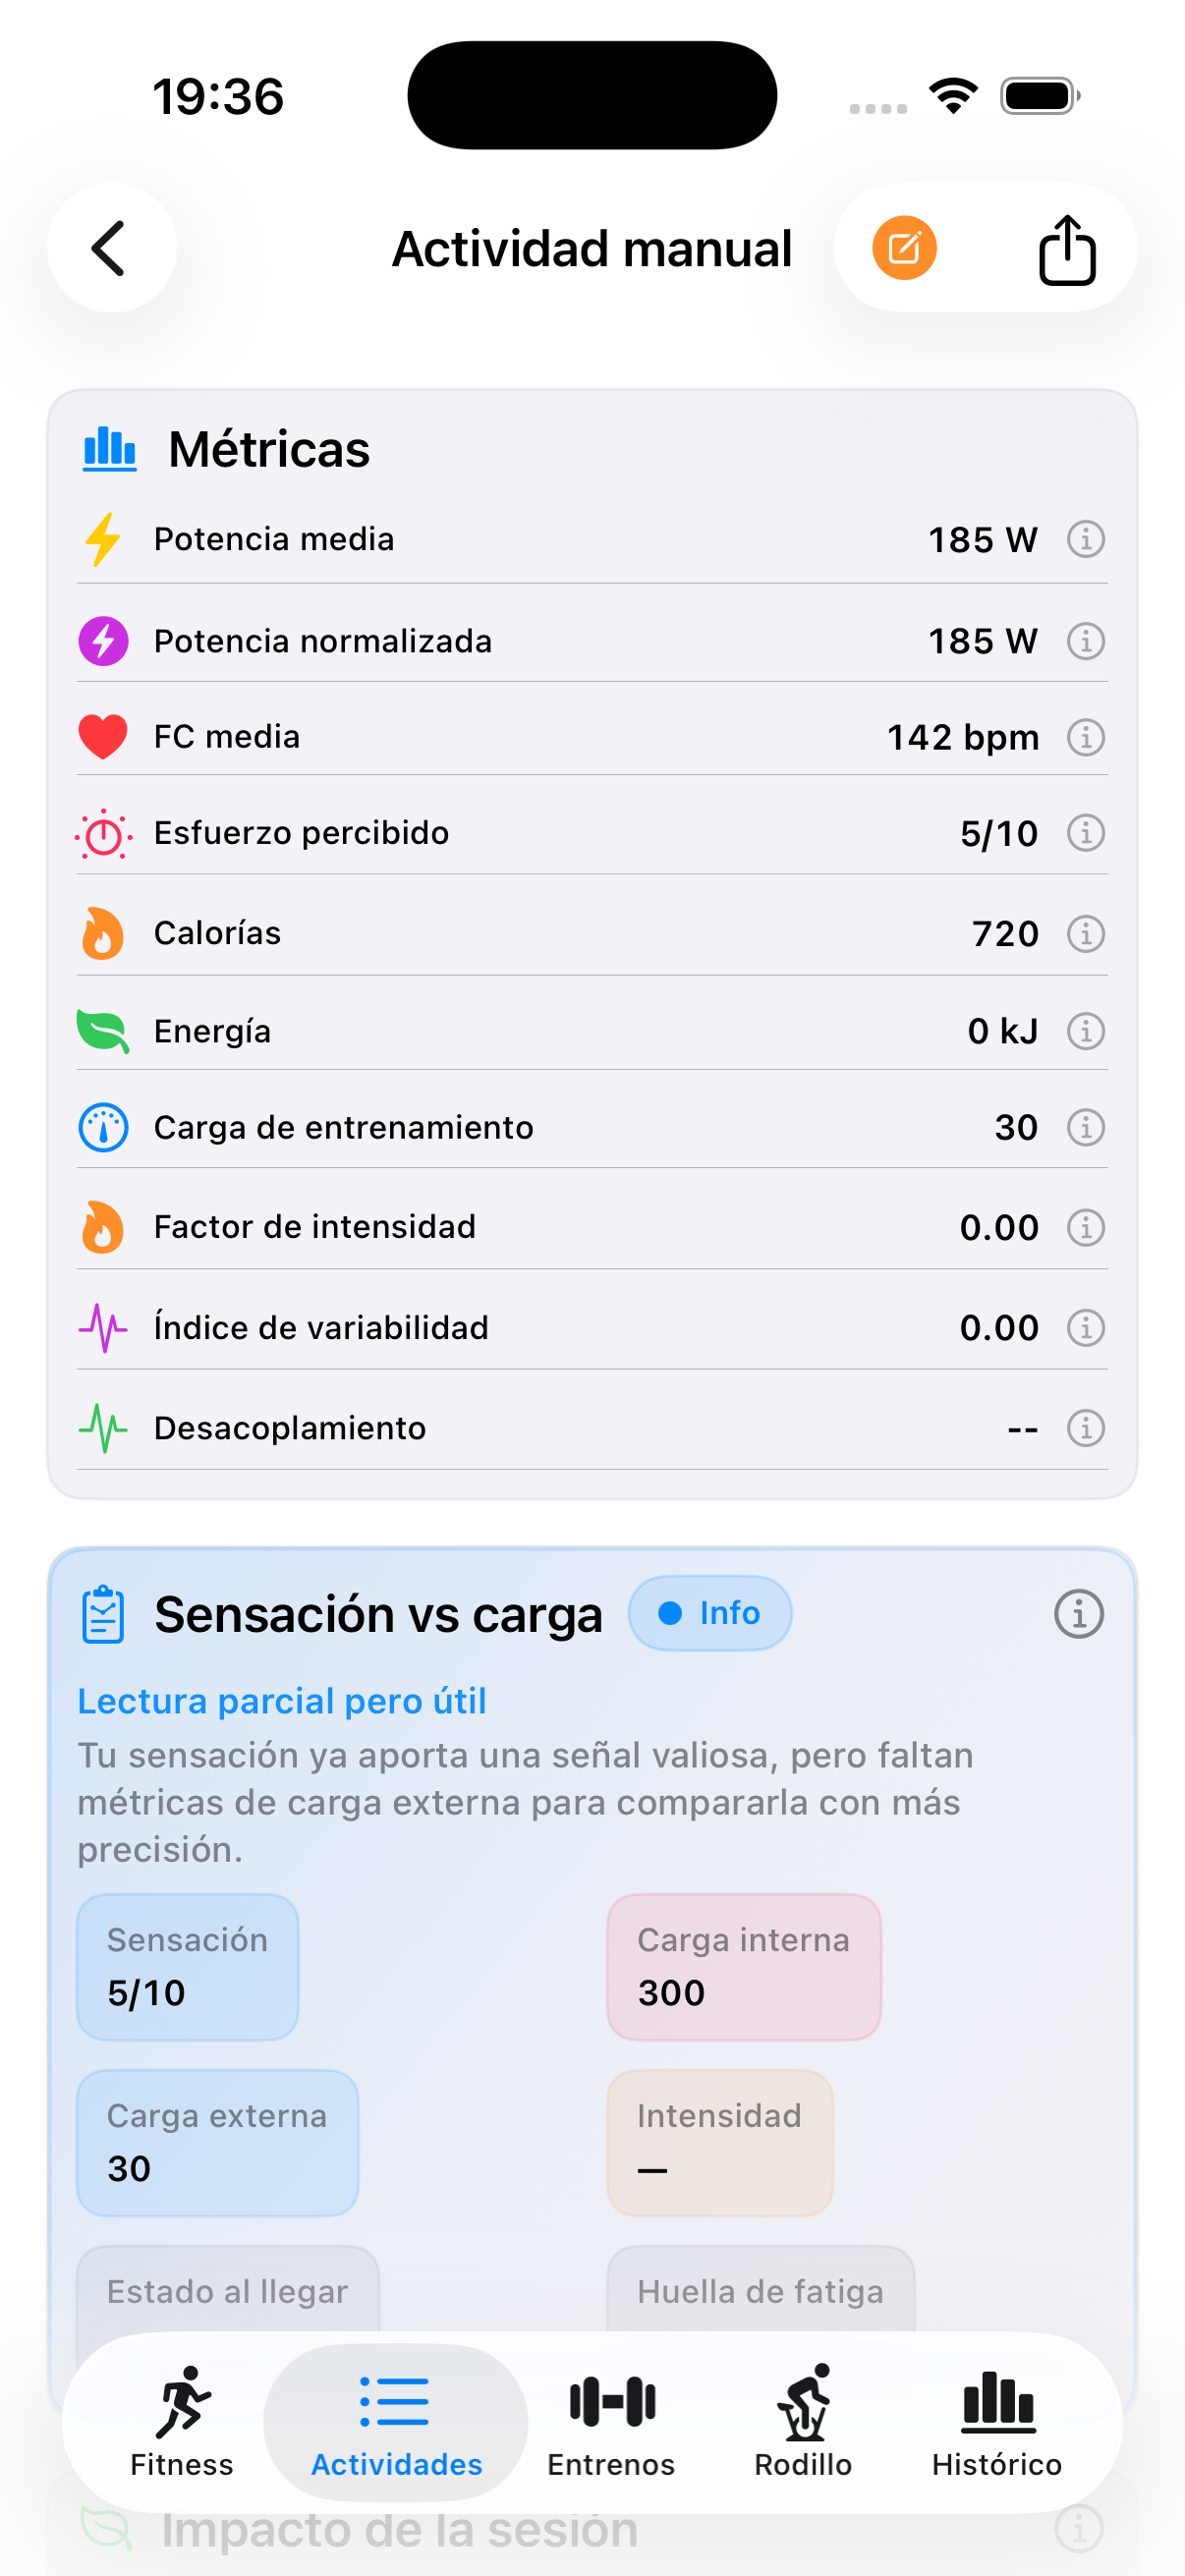
Average power, normalized power, average heart rate, perceived exertion, calories, energy (kJ), training load, intensity factor, variability index, and decoupling (aerobic drift between the first and second half of the ride).
Session impact, zones, segments, analysis
Scrolling down:
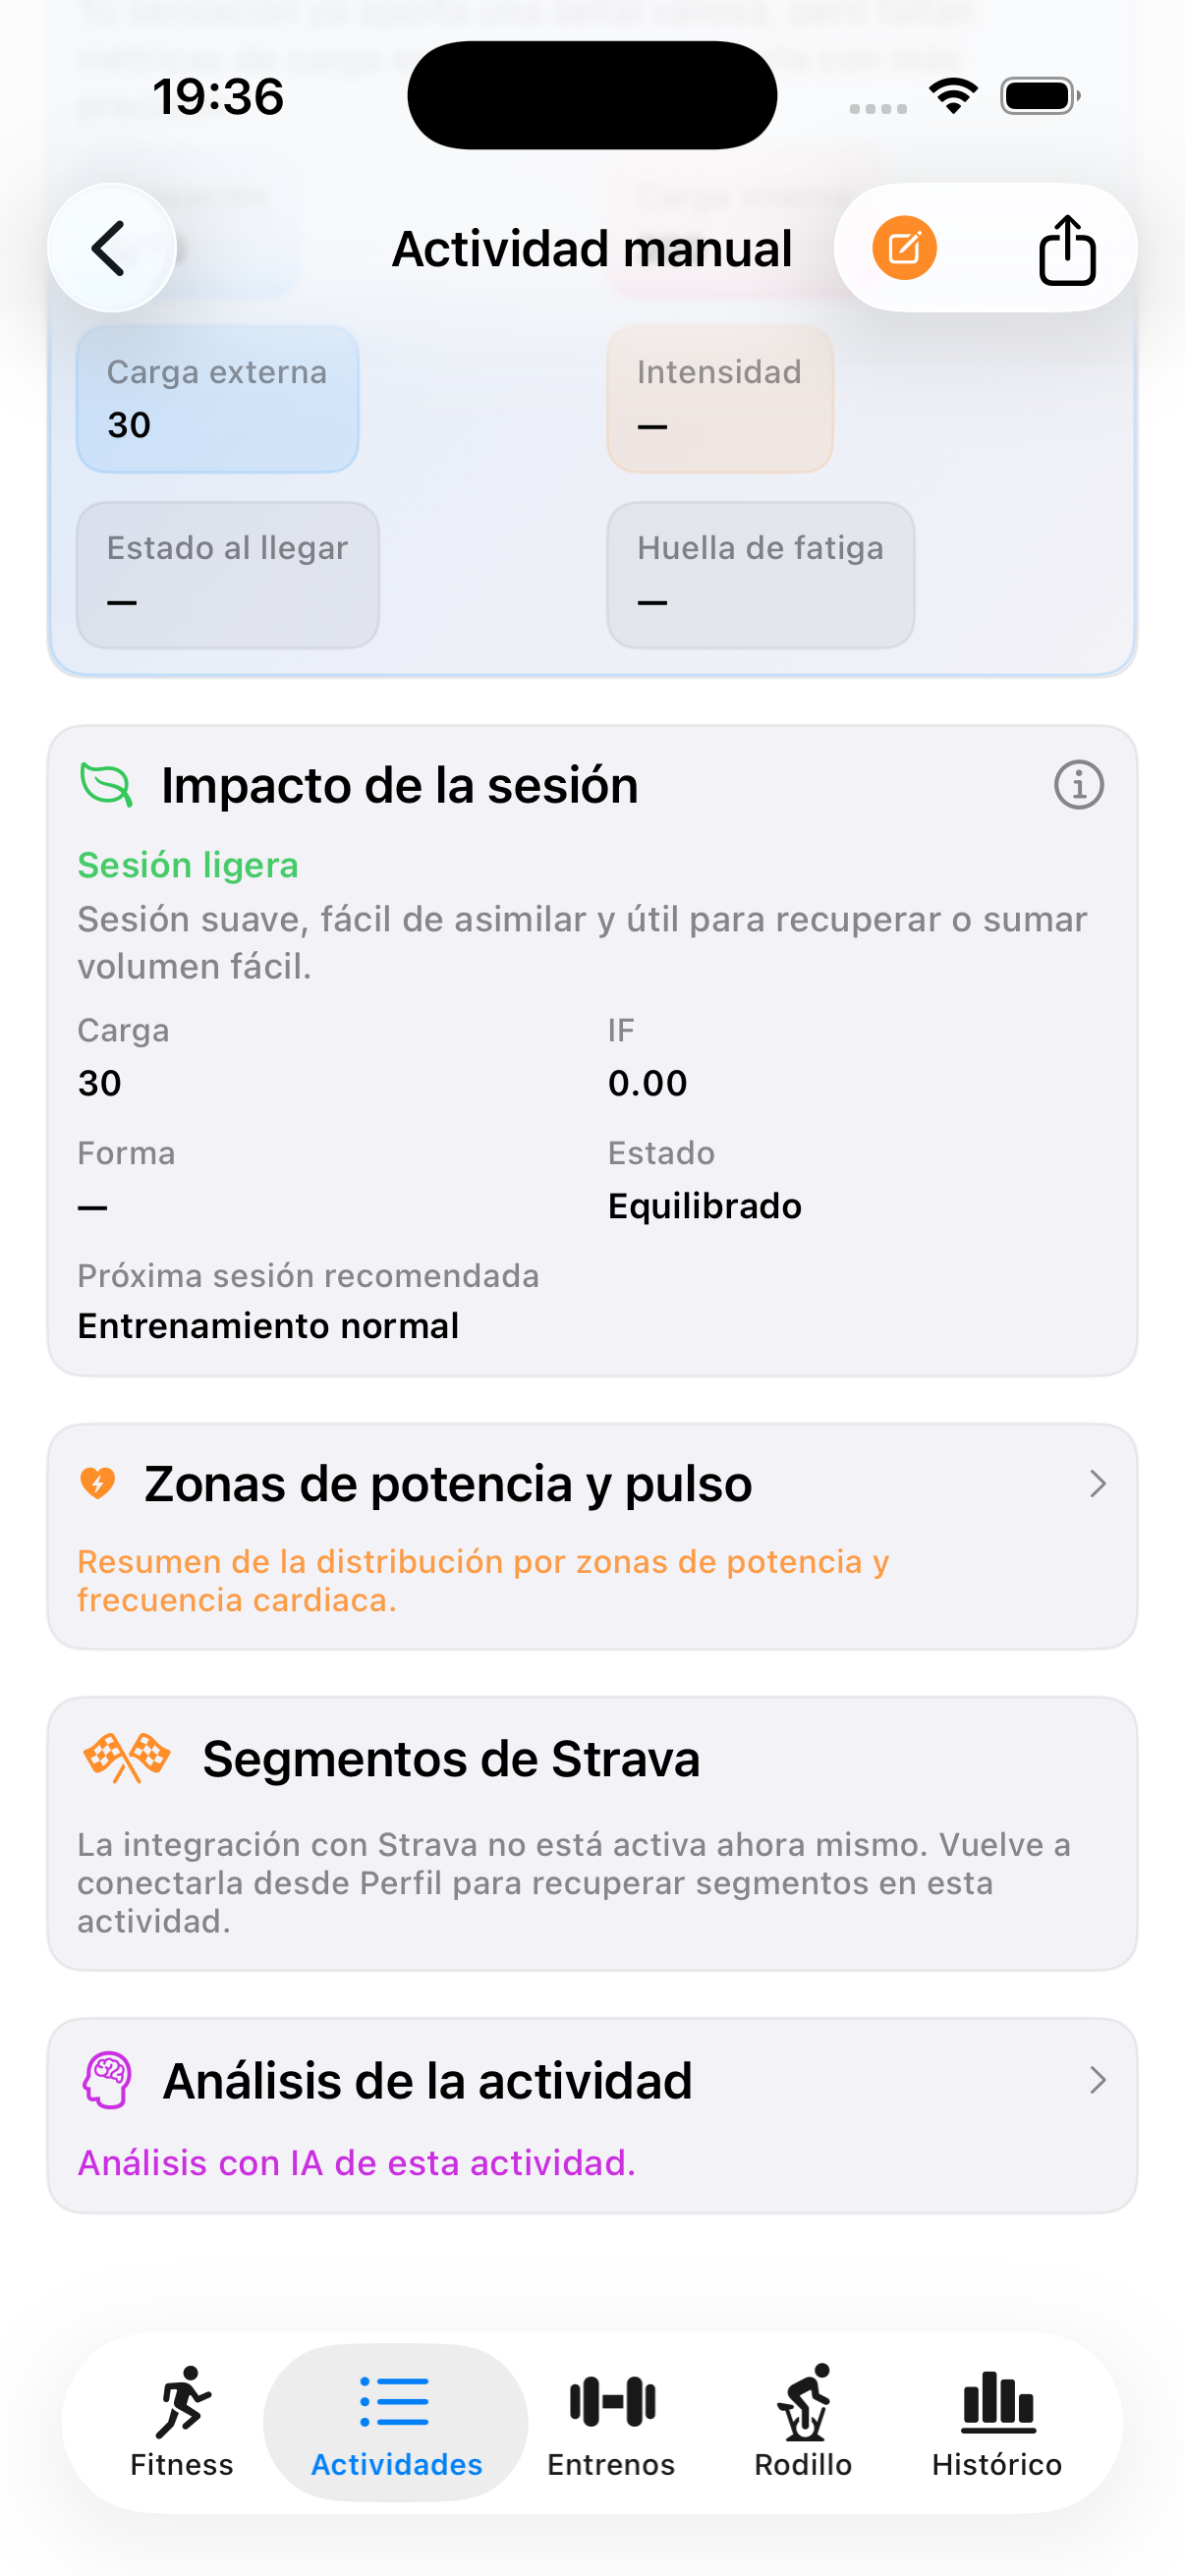
- Session impact: a plain-language read of how heavy this session was (light / moderate / hard), your training load, intensity factor, form, and a recommended next-session direction.
- Power and heart rate zones: time spent in each zone for this activity.
- Strava segments: your efforts on this ride's Strava segments, if Strava is connected.
- Activity analysis: the full write-up — AI-generated if you've enabled it with a valid OpenAI key, otherwise generated locally. Either way, it covers:
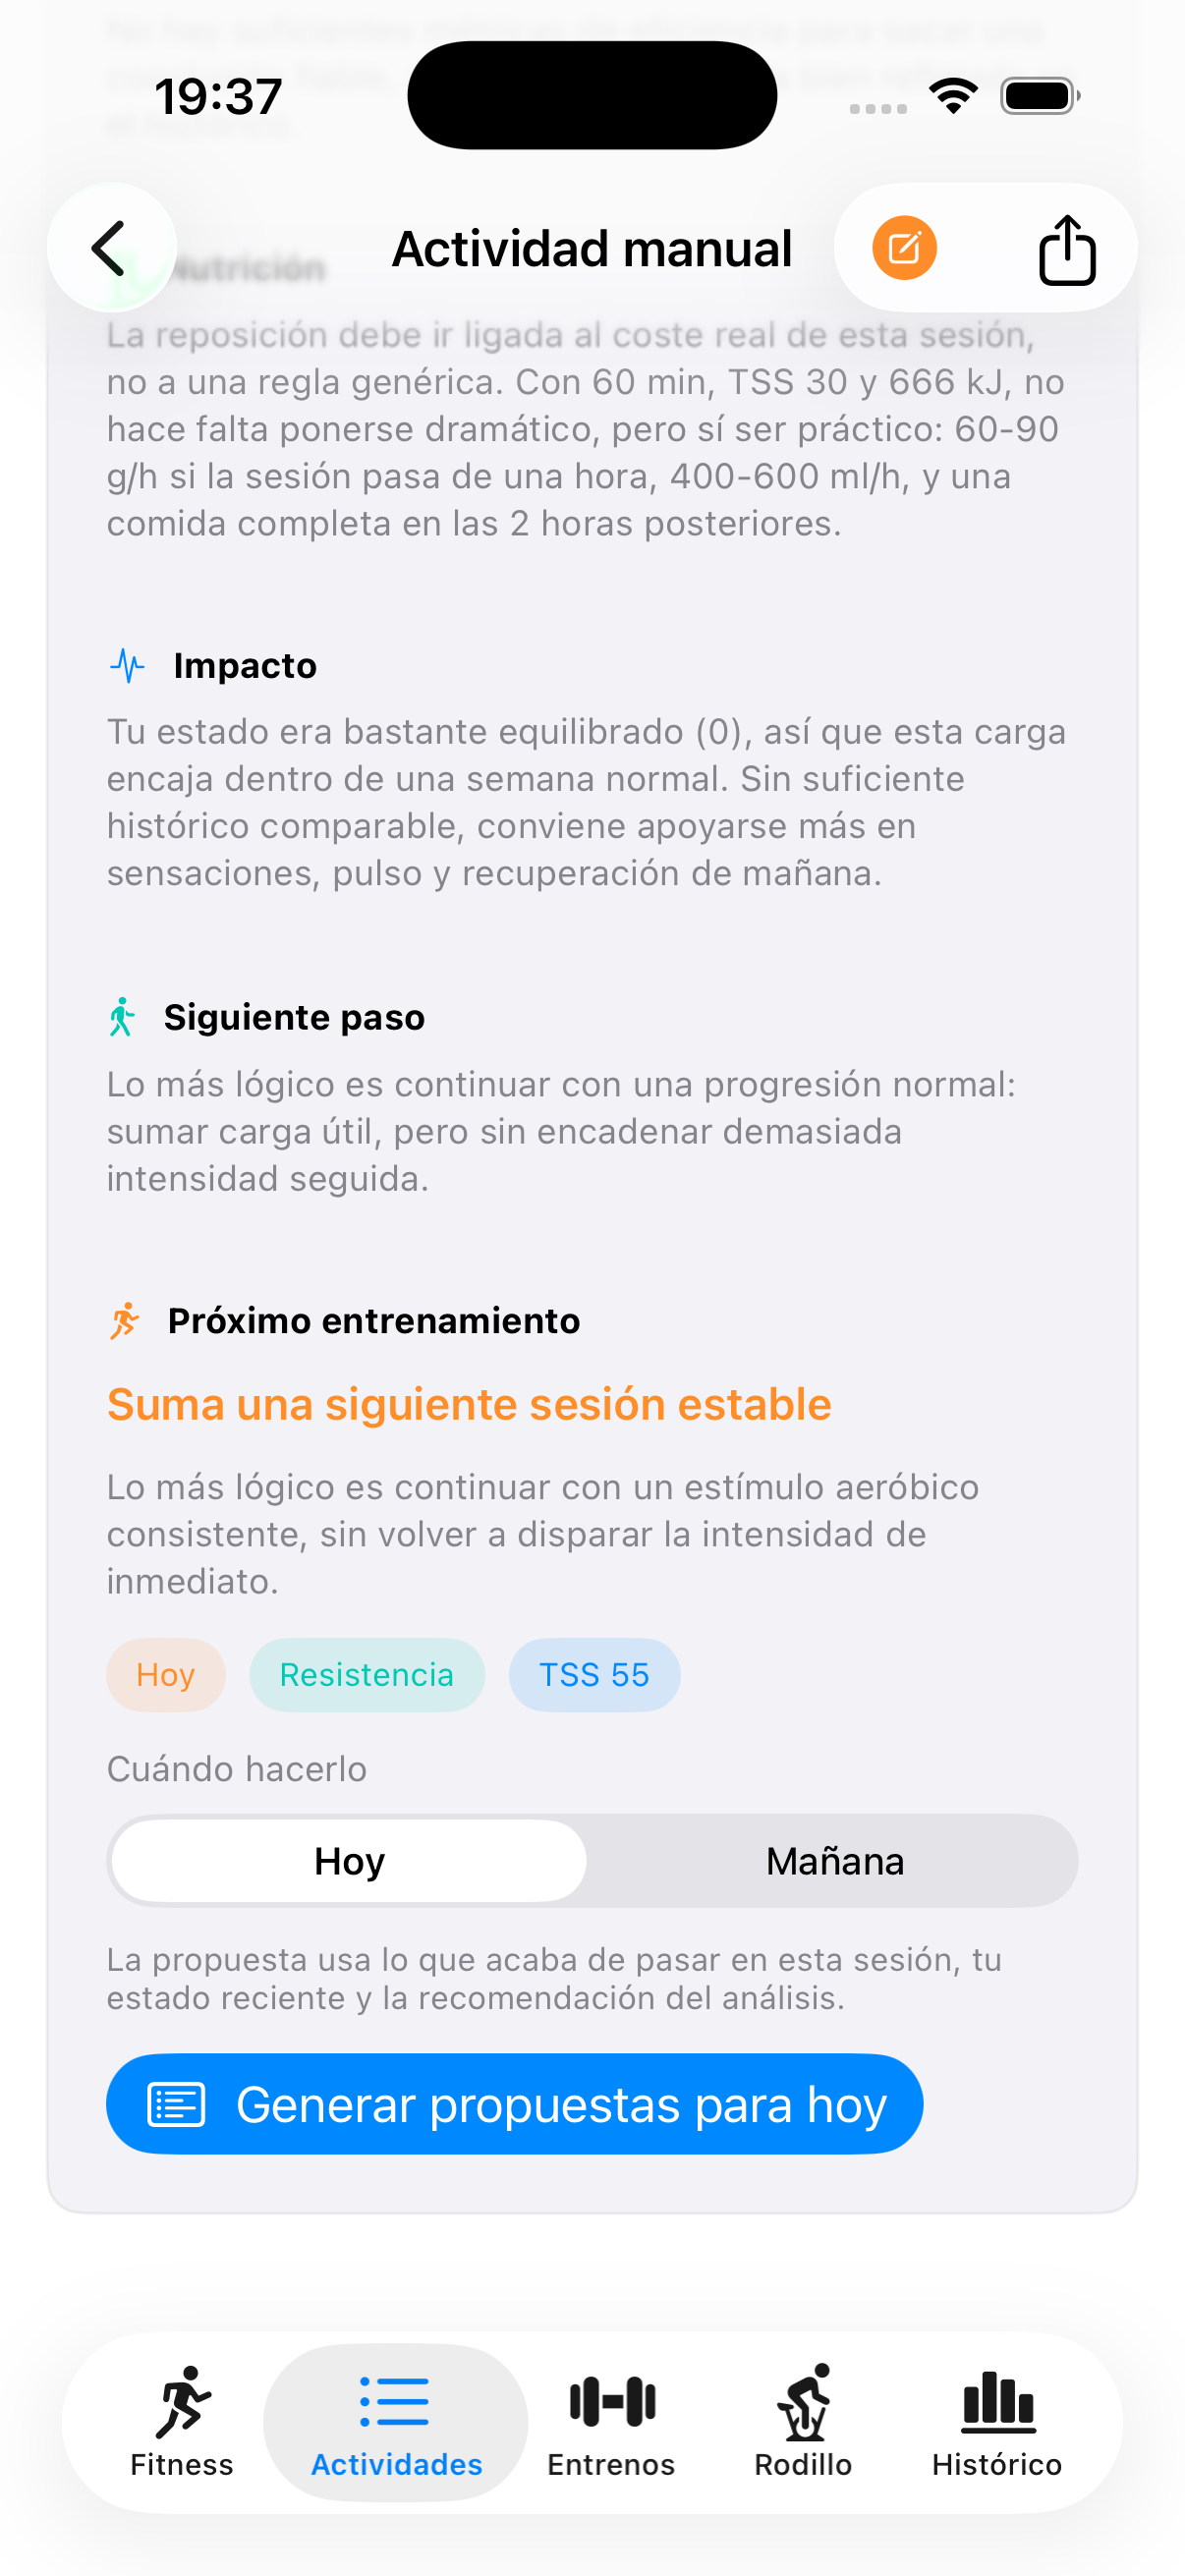
Summary, load, efficiency, nutrition guidance specific to this session's duration and energy cost, impact on your form, a suggested next step, and a concrete follow-up workout suggestion (today or tomorrow) you can generate directly from this screen.
Editing and deleting
The pencil icon in the top-right opens an edit sheet (name, distance, duration, elevation, perceived exertion) and, for activities that support it, a delete option — local-only or also removed from Intervals.icu, your choice.
Sharing
The share icon next to the edit button — see Sharing a session.